Welcome to Matplotlib Multicolored Line documentation!
Installation & Usage
Project Info
API Reference
Matplotlib Multicolored Line


Documentation: https://matplotlib-multicolored-line.readthedocs.io
Source Code: https://github.com/34j/matplotlib-multicolored-line
Plot multicolored lines in Matplotlib. Port of Multicolored lines — Matplotlib 3.10.1 documentation with slight improvements.
Installation
Install this via pip (or your favourite package manager):
pip install matplotlib-multicolored-line
Usage
import matplotlib.pyplot as plt
import numpy as np
from matplotlib_multicolored_line import colored_line
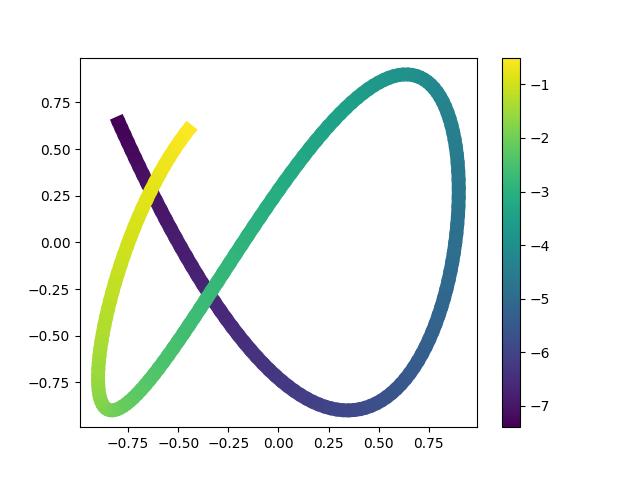
t = np.linspace(-7.4, -0.5, 200)
x = 0.9 * np.sin(t)
y = 0.9 * np.cos(1.6 * t)
fig, ax = plt.subplots()
lc = colored_line(x, y, c=t, ax=ax, linewidth=10)
fig.colorbar(lc)
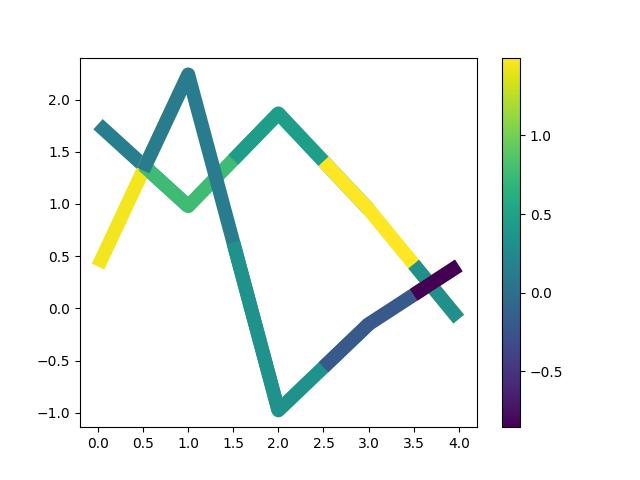
y = np.random.normal(size=(5, 2))
c = np.random.normal(size=(5, 2))

fig, ax = plt.subplots()
lc = colored_line(y, c=c, ax=ax, linewidth=10)
fig.colorbar(lc)
Contributors ✨
Thanks goes to these wonderful people (emoji key):
 34j 💻 🤔 📖 |
This project follows the all-contributors specification. Contributions of any kind welcome!
Credits
This package was created with Copier and the browniebroke/pypackage-template project template.